The exemplary curve
Regulation sets a floor. The exemplary climbs above it, largely unregulated.
What it is
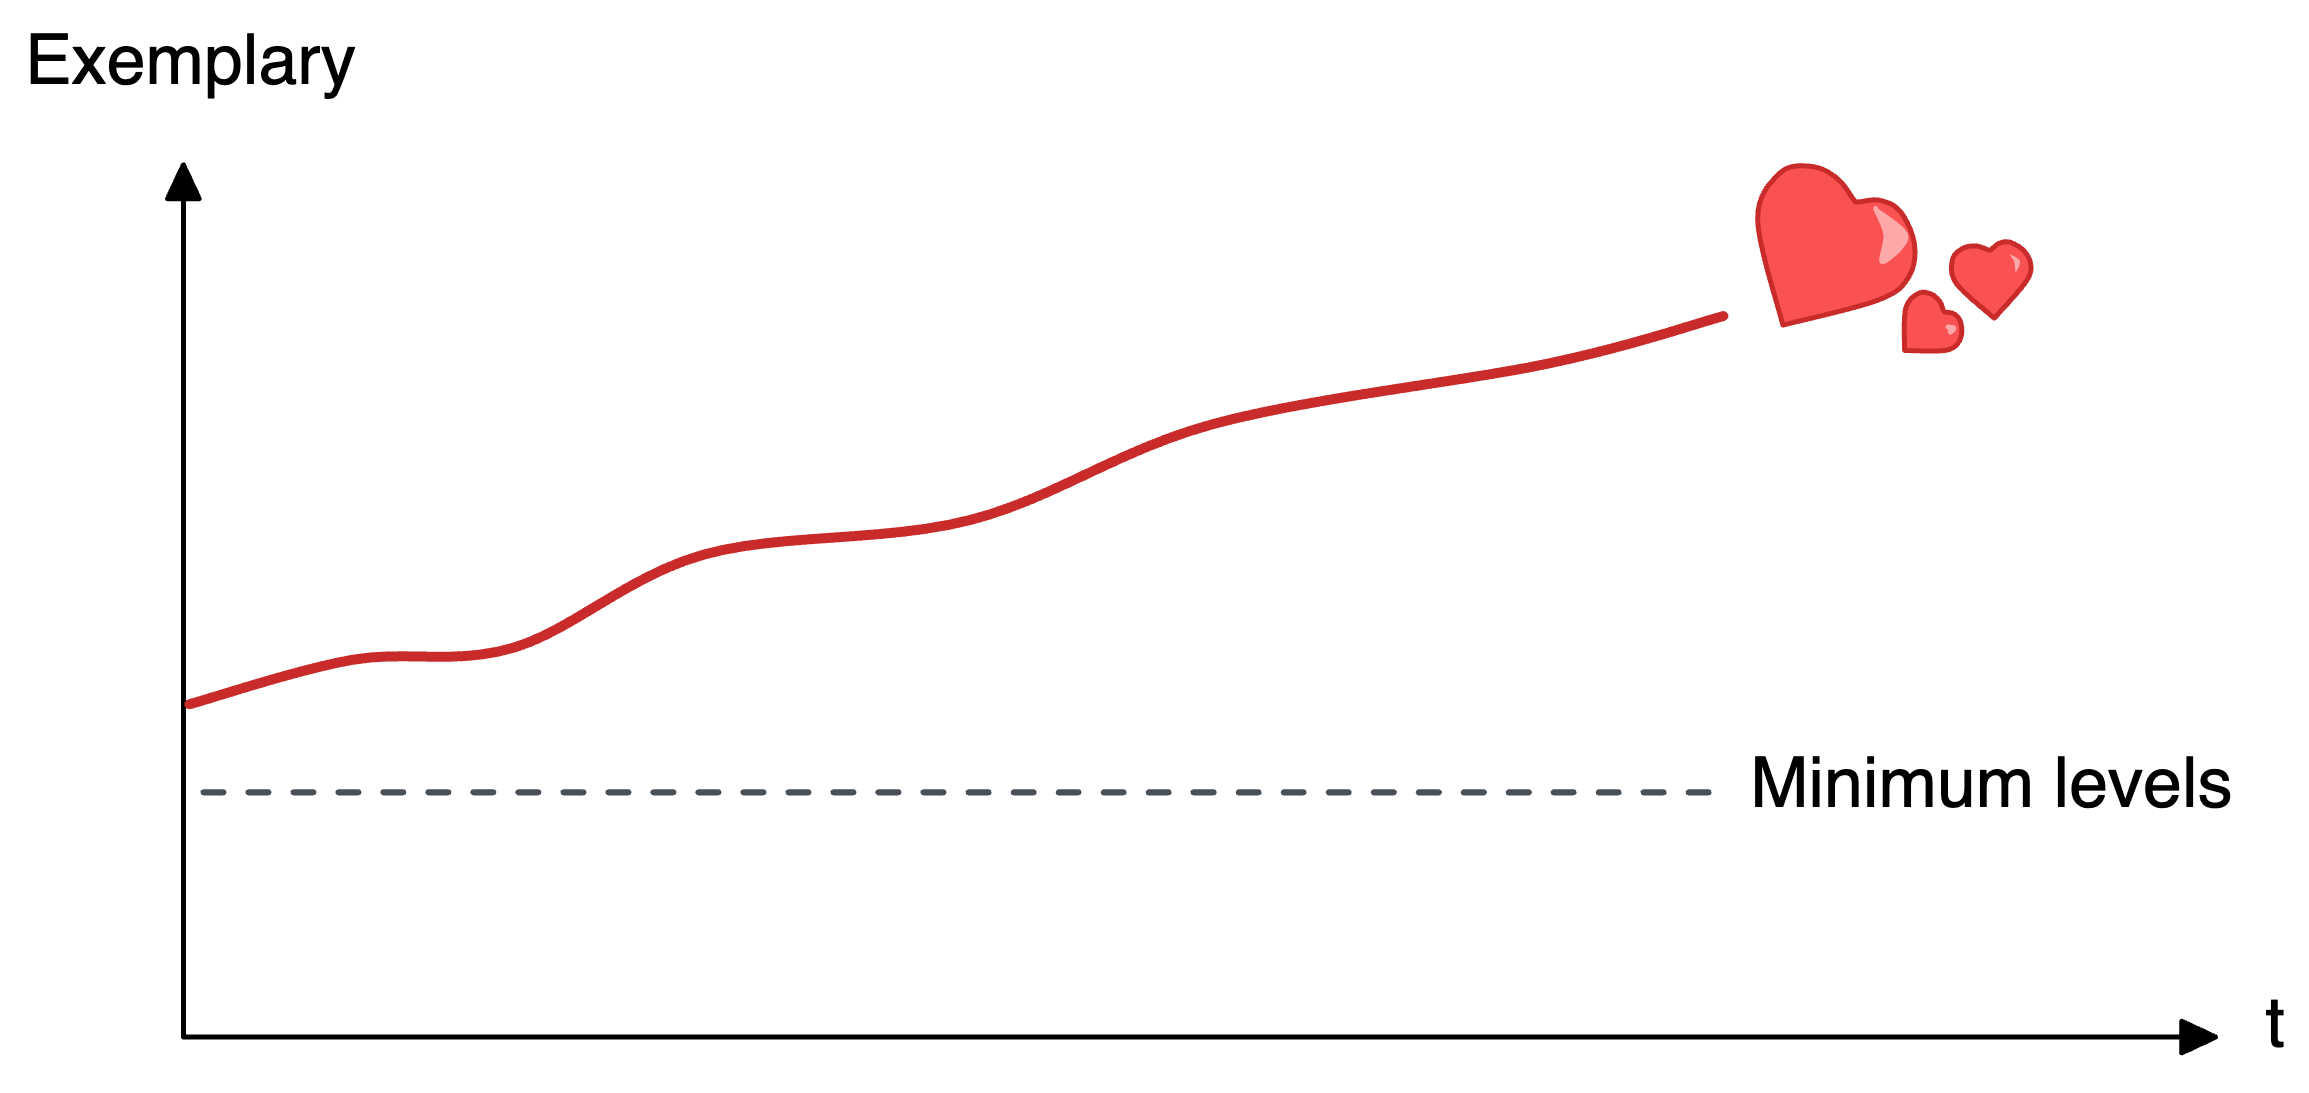
Standards and regulation set a floor, the dashed minimum-levels line. The most exemplary work climbs well above that floor, where almost nothing is required of you. No standard obliges you to be exemplary.
I draw the curve rising over time because the exemplary is a direction, not a threshold you clear once. I use it in the benchmarking work to keep compliance, meeting the minimum, and exemplarity, the unregulated space above the floor, as two different things and not two amounts of the same thing.
Download
A hand-drawn sketch, available as PNG for now.
License: Open Educational Resource
Everything I have created here is shared under the Creative Commons Attribution 4.0 International license (CC BY 4.0).
You may:
- Share: copy and redistribute the material in any medium or format.
- Adapt: remix, transform, and build upon the material.
Under the following condition:
Attribution: give appropriate credit and indicate if changes were made. A simple "Per-Olof Hedvall, peohedvall.com" is enough.
This applies only to content I have created. Any third-party content, such as quoted images, may be under a different license and is marked accordingly.